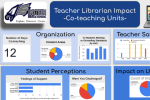
 David Vickers Loertscher and Michelle Young write: “This tutorial introduces school librarians to the use of data visualization tools for documenting and communicating their impact on teaching and learning. By leveraging accessible platforms like Google Forms and Google Sheets, the authors demonstrate how librarians can build dashboards and real-time visual reports to showcase co-teaching, instructional collaboration, and student engagement. The tutorial features real-world examples, highlights common data sources already available to librarians, and argues that dynamic visual storytelling is a powerful alternative to traditional library statistics.”