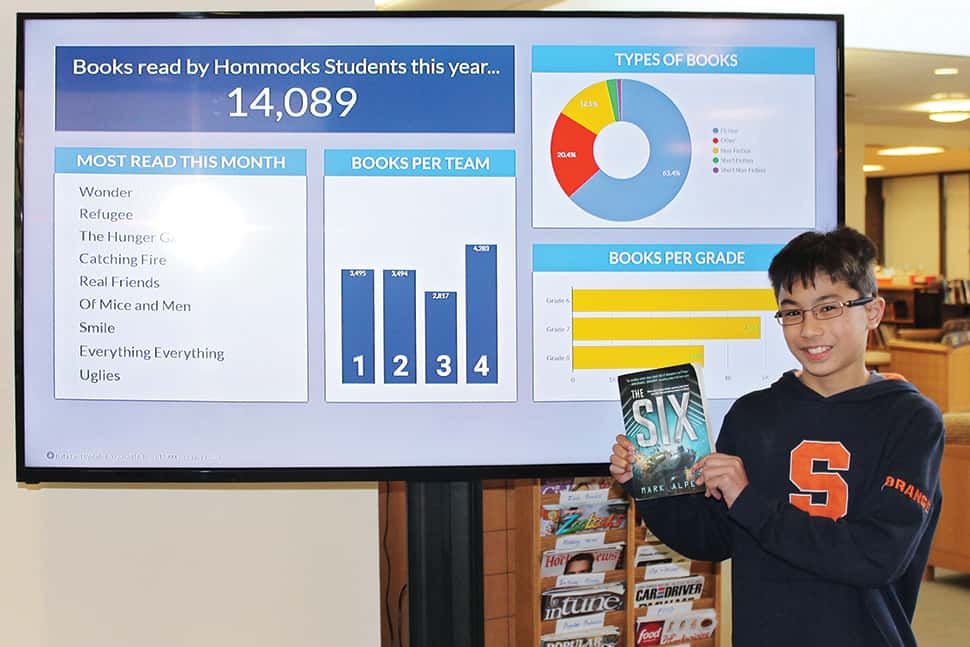
Hommocks Middle School in Larchmont, New York, wanted to find out what its students were reading independently. School Librarian Kelsey Cohen helped set up a system that encourages kids to log their reading choices and gives both students and teachers instant visual feedback on what books are popular.
I’ve met many voracious readers. They are at our library door with their faces pressed against the glass each morning. They check out multiple books at a time, have a “to-read” list, and take risks with new genres, formats, and authors without hesitation.
But in the last few years, my colleagues and I have committed ourselves to reaching those who aren’t pressing their faces against the glass. How do we know what or even whether they are reading? How do we get books they can—and most importantly want to—read in their hands? For an institution of 1,300 students like Hommocks Middle School, this is not an easy task.
To launch our inquiry into how best to support these striving readers, Assistant Principal Rob Andrews developed the idea of replacing paper-based reading logs with a Google form that students could complete after either finishing or abandoning a book. Logging independent reading has been a longstanding procedure, but this idea would link that data together so teachers, administrators, our Literacy Coach Lisa Ramos-Hillegers, and I could all use it. If students weren’t reading, if they finished a book but had no idea what to read next, or if they abandoned multiple books in a row, we would know in real time. It was a game-changer.
We learned a lot the first year. We were asking too much. Our striving readers were not taking the time to complete the forms, so the data wasn’t accurate. The form’s length also made it difficult for us to sort the data in the monster Google spreadsheet where the data came together. So we whittled it down to the essentials. Second, the students saw it as a thankless chore because they couldn’t access their digital logs to use the records themselves. This made it meaningless.
Enter our instructional technology coach, Mike Sammartano, who declared, “Let’s make a data dashboard!” He went to work with Google Data Studio and unveiled the hook for students, a collection of colorful graphs, charts, and lists that made the data come to life. (See how he used Google Apps to put it all together in this video). Students could see the most popular books read that month, how many books the entire school read, and the genres that were most often selected.
I started displaying it on a large monitor in the library. Kids ran up to it, sharing what they’ve read on the top 10 list and watching the total number of books read vary from week to week. Sammartano set up weekly emails to students that included their personal log. Our students became engaged in a meaningful way.
This increase in student engagement led more teachers to buy into the concept. Some started to use the data during reading conferences. Sixth-grader Avi Mehra noticed that he was reading only science fiction when he reviewed his log with his teacher. “I decided to read Scar Island after that because it was realistic fiction,” he said. “The data monitor is a good way to keep [my teacher] up to date, and I like to see what I’ve read so far and what I’ve liked because I will reread it if I like it a lot.”
Ramos-Hillegers and I used the data to help students who were struggling get into a reading rhythm. We gave them first dibs on new book arrivals and created personalized book bins for them to peruse in classrooms. We used book trends to develop robust library collections. We became responsive to our readers’ wants and needs.
There are still challenges and improvements we would like to make. We are hoping to develop an app using WorldCat, our student information system, and the library catalog so students can log their reading more efficiently, access a copy of their next book quickly, and see tailored recommendations. Expanding the use of the digital log within our district will allow us to track a student’s reading journey from kindergarten to graduation. The more we learn about our readers, the more ideas we generate.
This collaboration was a catalyst for me to rethink my role as a school librarian. I stopped waiting for the readers to walk through the door and started strategically reaching out to them. Here’s to more and more students pressing their faces on the library door glass each morning!